Canvas
A canvas is the workspace where you design and run workflows in SuperPlane. It’s a visual graph of nodes connected by subscriptions that define how events flow between steps.
Think of a canvas as:
- A workspace for designing workflows visually
- A live system where multiple runs can execute simultaneously
- A graph that defines all possible execution paths
- A unified view of your automation logic
A single canvas can represent multiple possible workflows, depending on which paths events take through the graph. The canvas provides a place to model complex, event-driven workflows that span multiple tools, wait for human input, and run over extended periods of time.
Visual Layout
Section titled “Visual Layout”The canvas page displays nodes, connections, status indicators, and provides tools for building and managing your workflows.
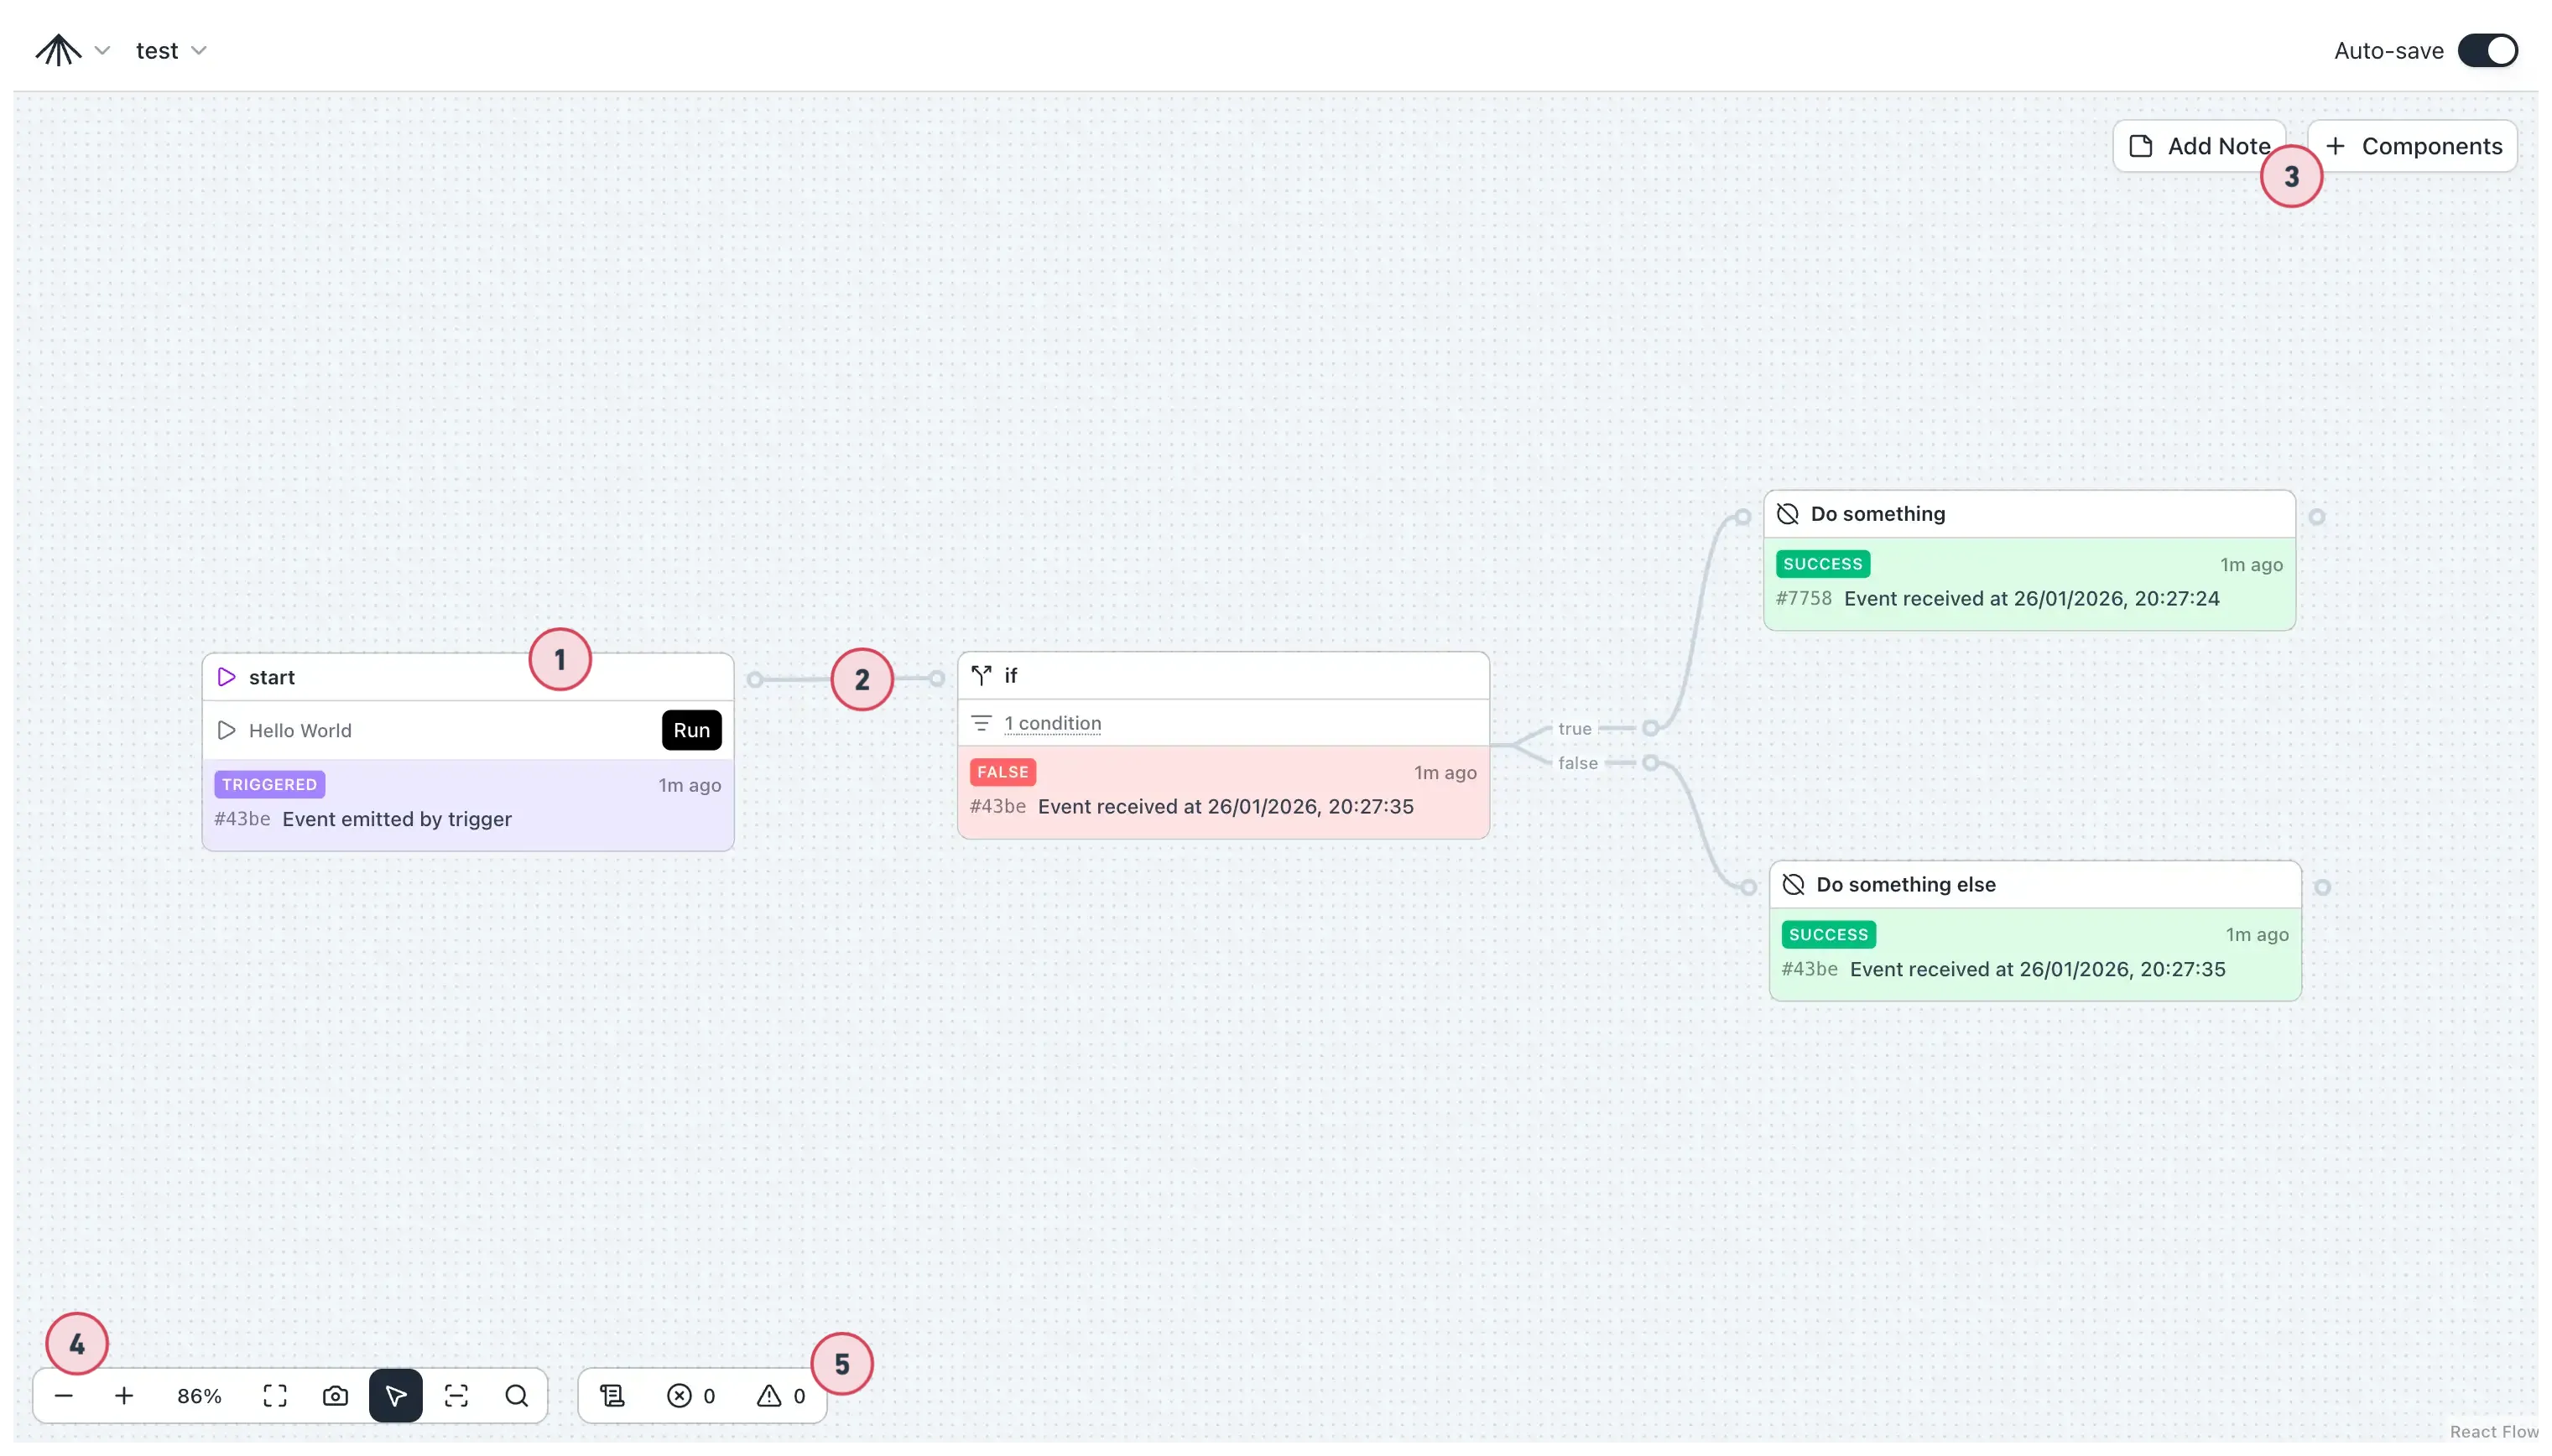
The canvas consists of:
- Nodes — Instances of components, the core building blocks. See Component Nodes.
- Connections — Indicate which node listens to which. See Data Flow.
- Add new elements — Add annotations and new components to the canvas.
- Helper toolbar — Navigation tools, select/pan mode, search.
- Console — Warnings, errors, and log of changes and events.
Editing and Updating Canvases
Section titled “Editing and Updating Canvases”You can edit and update canvases in two ways:
Visual Editor (UI)
Section titled “Visual Editor (UI)”Use the visual editor to build and modify canvases interactively:
- Add nodes: Drag components from the component palette onto the canvas
- Connect nodes: Create subscriptions by connecting nodes together
- Configure nodes: Click on any node to edit its configuration
- Delete elements: Remove nodes or connections as needed
Changes are saved automatically, and you can see your workflow update in real-time.
Command Line (CLI)
Section titled “Command Line (CLI)”Use the SuperPlane CLI to manage canvases programmatically:
# Export a canvassuperplane get canvas <canvas_name> > my_canvas.yaml
# Edit the YAML file# ... make your changes ...
# Apply updatessuperplane update -f my_canvas.yaml
The Canvas Page
Section titled “The Canvas Page”Nodes and Connections
Section titled “Nodes and Connections”Nodes are instances of components. To add a node, click ”+ Components” and drag onto the canvas. Connections define how events flow between nodes — drag from a source node’s output channel to a target node.
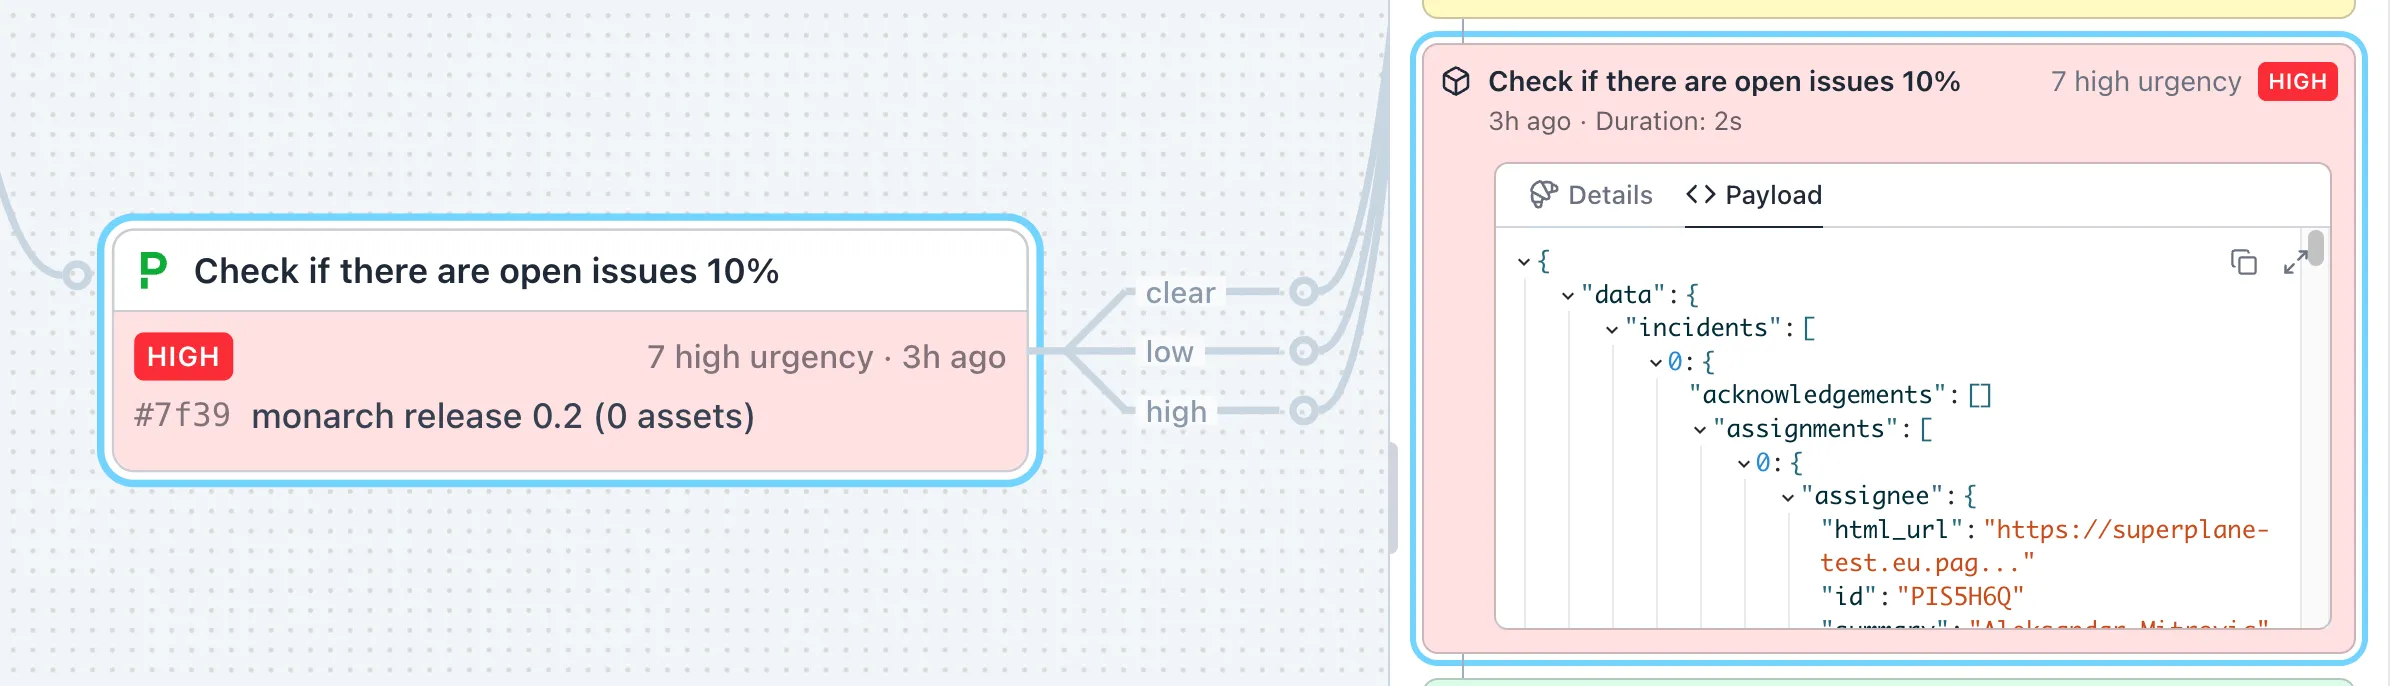
Nodes show status badges (running, succeeded, failed) and key information from their latest payload. For details on components, see Component Nodes.
Payloads and Events
Section titled “Payloads and Events”Every node emits a payload — JSON data containing the results of its execution. Click any node and view the Payload tab to inspect it.
When configuring nodes, type {{ in expression fields to access payload data from upstream nodes.
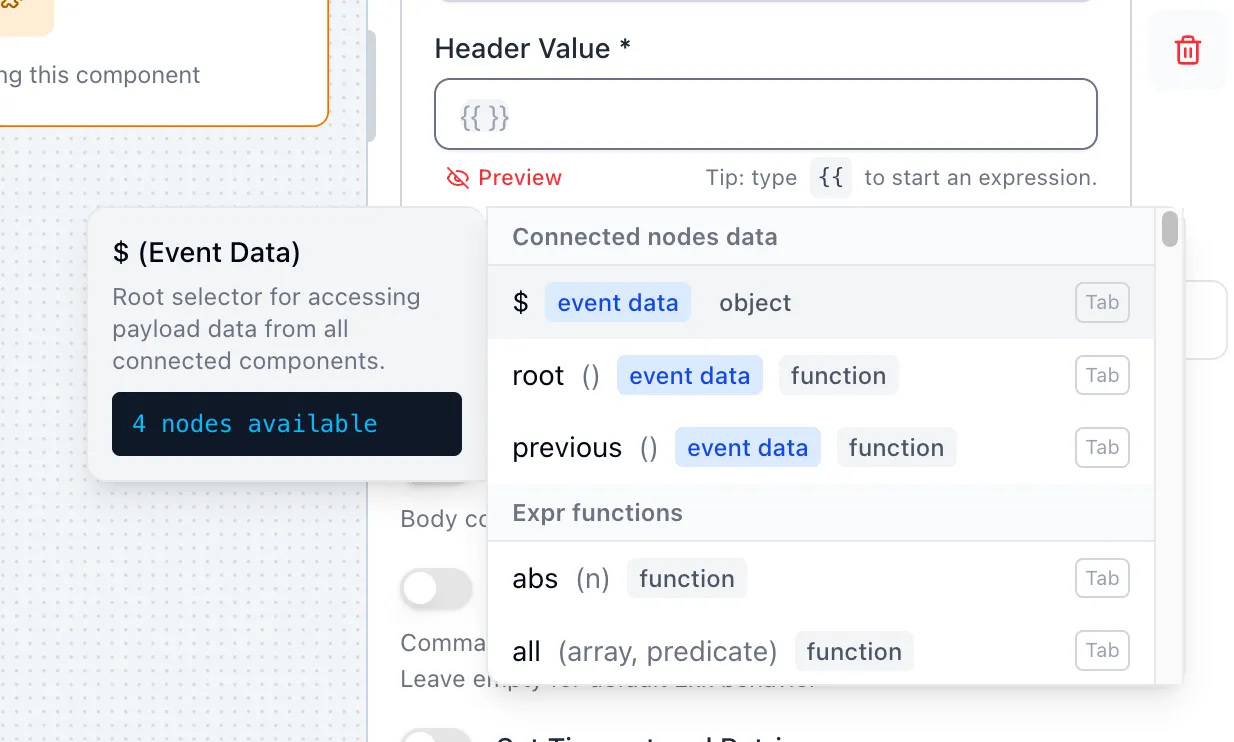
Use $['Node Name'].field to reference data from any connected node. See Data Flow
for more details.
Workflows and Runs
Section titled “Workflows and Runs”A single canvas can express multiple workflows depending on which trigger fires and which paths events take. Multiple runs execute simultaneously — the canvas updates in real-time as runs execute, with each node showing its current or most recent status.
Click any node to view its run history. Select a run item to see the full run chain showing all nodes that executed as part of that run.
Console
Section titled “Console”The console tracks errors, warnings, and provides a log of all changes and events on the canvas.
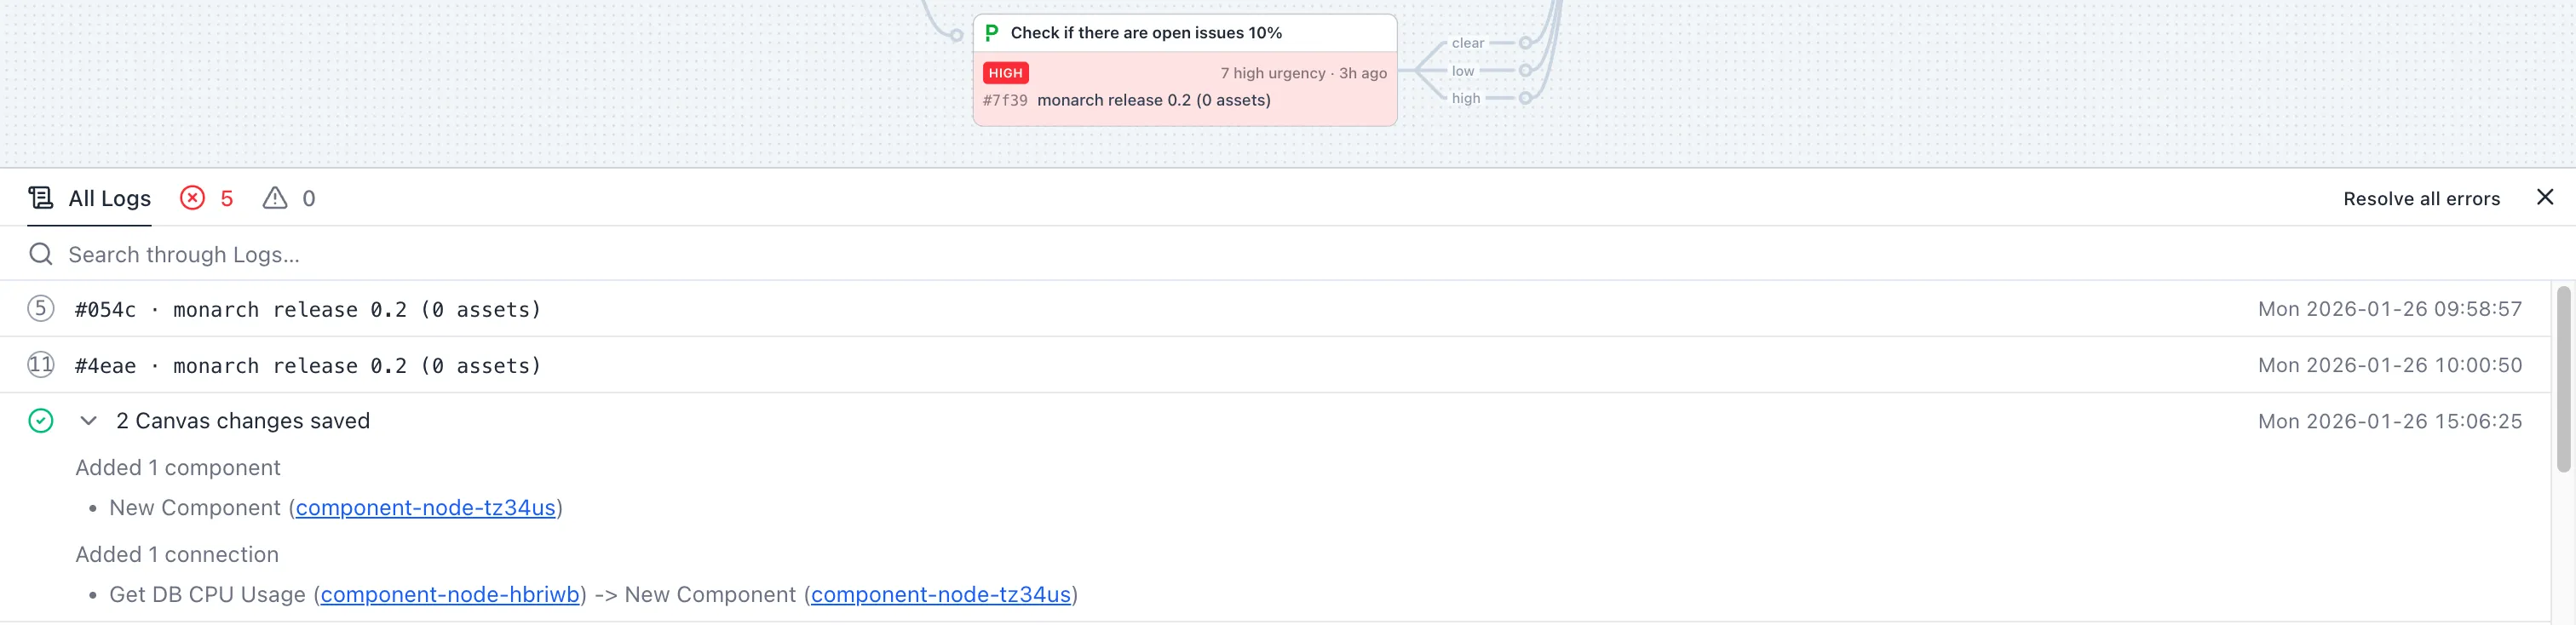
- Errors and warnings — Count indicators show issues needing attention
- Canvas changes — Logs when components or connections are added, updated, or removed
- Run details — Execution logs for each run
- Search — Filter through logs to find specific events
Best Practices
Section titled “Best Practices”- Organize logically: Group related nodes together visually
- Use clear node names: Make it easy to understand what each node does
- Test incrementally: Build and test workflows step by step
- Monitor the console: Check for errors and review run history regularly
For more details on data flow, see Data Flow. For component details, see Component Nodes.